Simple and interactive walk-through using Amazon Stock Data
Ready this Article on Medium for Free
Are you interested in developing your finance skills using some programming? Then you are at the right place. In this post, I will walk you through some great hands-on exercises that will help you to have some understanding on how to use Python for finance. First, I’ll introduce you to our friend Pyhton and then we will get to the fun part which is programming. As mentioned in the subtitle, we will be using Amazon Stock Data. If you are wondering is it free to get that data, the answer is absolutely yes. The stock data is avialble on NASDAQ official website. The NASDAQ (National Association of Securities Dealers Automated Quotations) is an electronic stock exchange with more than 3,300 company listings.
The Amazon stock data can be downloaded from here. On this website, you can find stock data for different companies and practice your skills using those datasets. I can’t wait, let’s get started!
Python
Python is a general-purpose programming language that is becoming ever more popular for analyizing data. Python also lets you work quickly and integrate systems more effectively. Companies from all around the world are utilizing Python to gather bits of knowledge from their data. The official Python page if you want to learn more.
Understanding the Data
When you first load data into a dataframe, it is a good practice to take a look at it before you start manipulating it. This helps to understand that you have the right data and some insights about it. As mentioned earlier, for this exercise we will be using historical data of a company from NASDAQ. I thought Amazon would be a good one to go with. After walking through with me on this exercise, you will learn some skills that will give you that ability to practice yourself using different datasets.
The dataframe that we will be using contains the closing prices of Amazon stock of the last one month (June 24 – July 23, 2020).
- Index: the date of the closing.
- Price column: closing price in dollars.
- Volume column: number of shares traded that day.
Import Data
import pandas as pd
amzn = pd.read_csv('amzn_data.csv')
Head
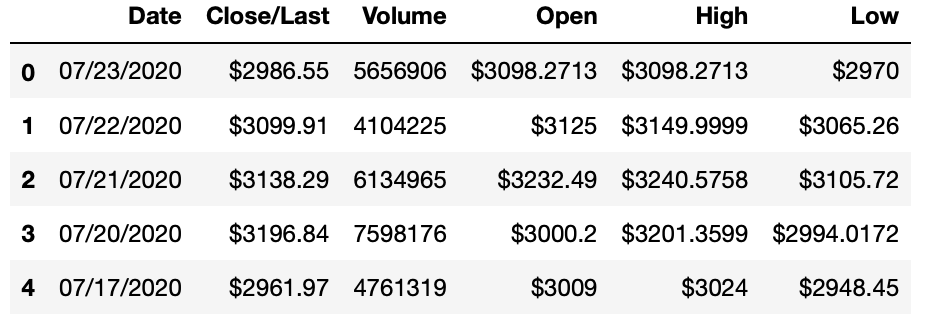
The first thing we’ll do to get some understanding of the data is using the head method. When you call head method on the dataframe, it displays the first five rows of the dataframe. After running this method, we can also see that our data is sorted by date index.
amzn.head()
Tail
Another helpful method we will call is the tail method. It displays the last five rows of the dataframe. Let’s say if you want to see the last three rows, you can input the value 3 as integer between the parentheses.
amzn.tail()

Describe
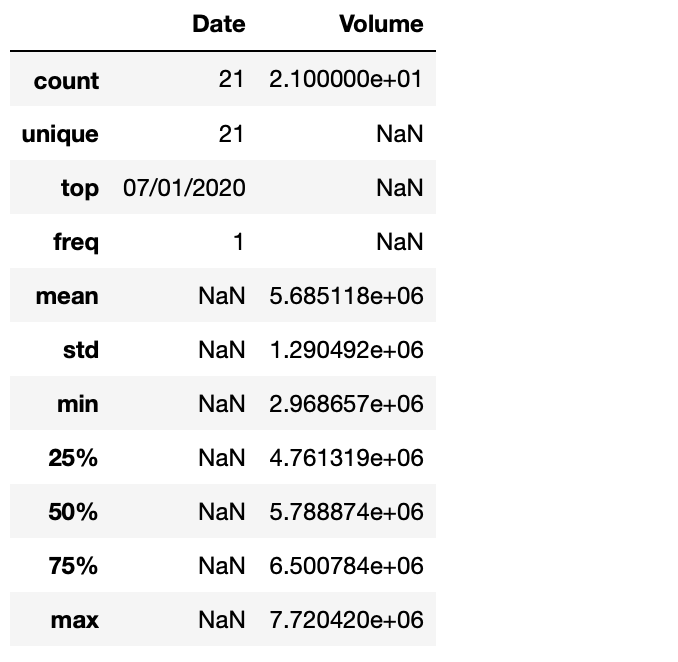
Last method that we’ll call before we get deep is the describe method. It returns us the statistical summary of our data. In default, the describe method will return the summary statistics of all numerical columns, for example in our example all columns are numerical. The summary will include the following items: rows count, mean, standard deviation, minimum and maximum values, and lastly the percentiles.
amzn.describe()
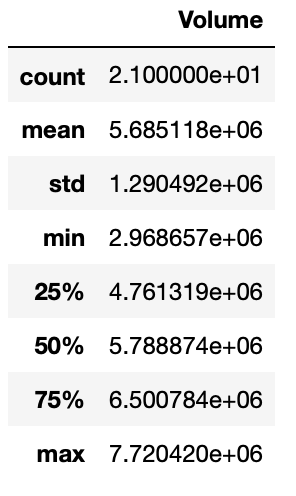
Why are we just getting values for Volume column and not other columns. Here comes what we call Data Preparation. Cleaning data and making it ready for analysis is major step. In our case, there couple things we have to care before we go next steps.
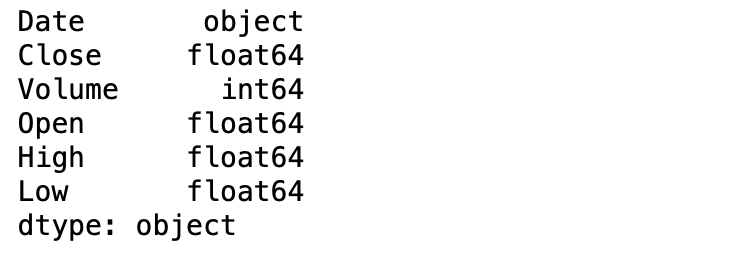
We mentioned earlier that describe method works specifically with numeric values, this mean that Volume column was the only numeric value in our dataframe. Let’s check the data types of our columns.
amzn.dtypes

As you can see, Volume column is the only integer type and the rest is object type. So we have take care of the data types. But before converting them, we have clean the dollar sign, otherwise our program will get confused when trying to convert dollar sign to numeric value.
amzn = amzn.replace({'\$':''}, regex = True)
amzn.head()
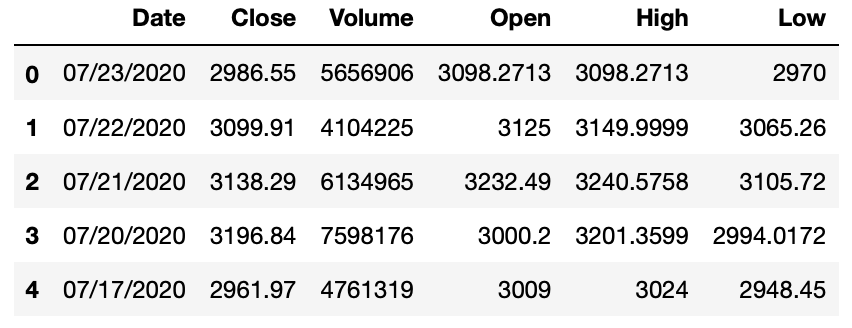
Good, now we can convert the data types. We don’t need to change anything with Date and Volume columns. We will convert the rest columns into a numeric value, for this exercise we can go with float numeric type.
df = amzn
df.columns = ['Date', 'Close', 'Volume', 'Open', 'High', 'Low']
df = df.astype({"Close": float, "Volume": int, "Open": float, "High": float, "Low": float})
df.dtypes
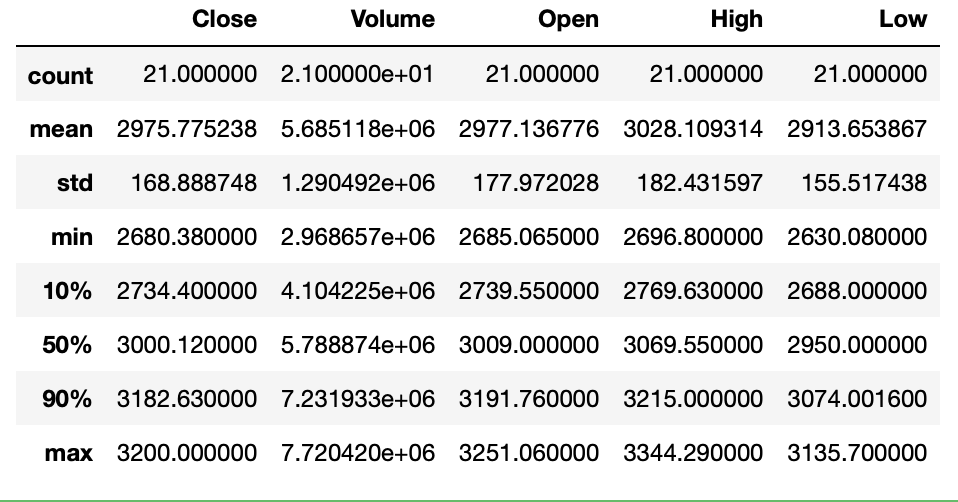
Great, we solved the data type issue. Now, let’s try to run the describe method and see how it works.
df.describe()
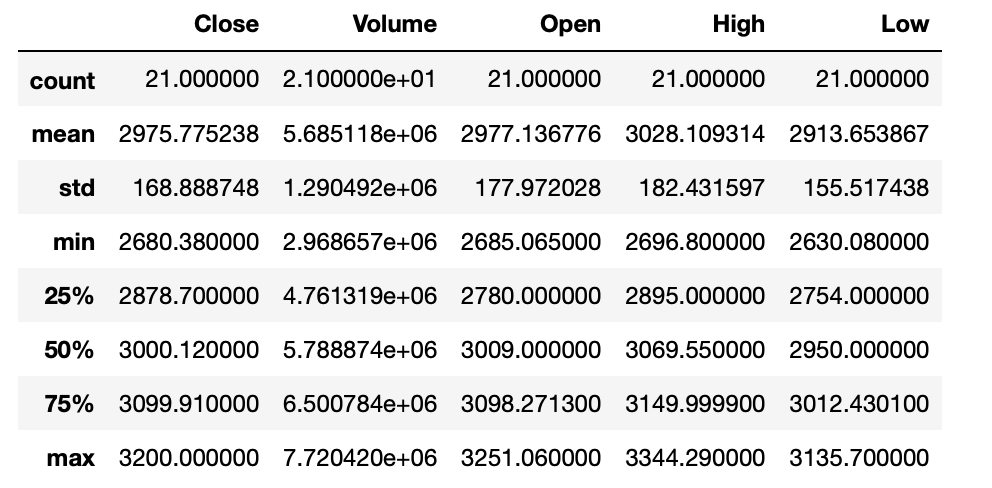
Well done. Now as you can see above, the describe method worked perfectly with all our numeric columns. We can also customize our results for the describe method by using different parameters. Describe has three parameters that we will use in this example: include, percentiles, and exclude.
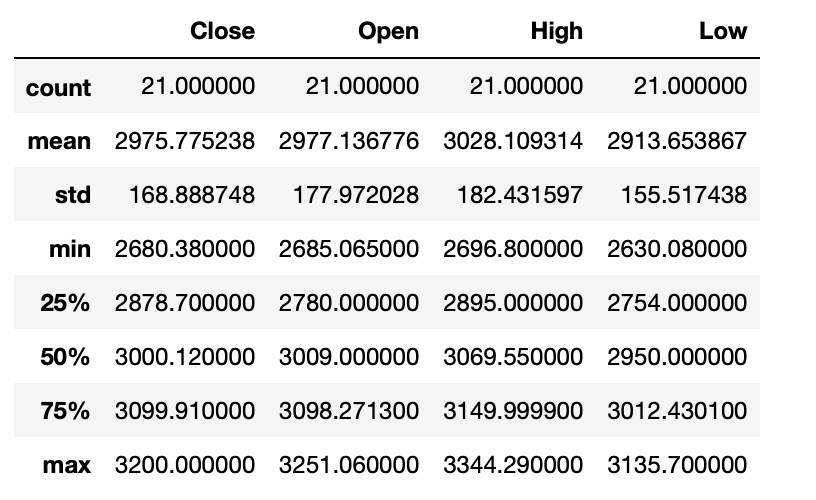
df.describe(include = "float")
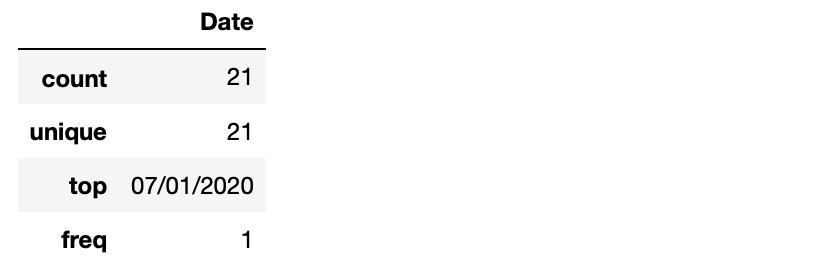
df.describe(include = "object")
df.describe(exclude = "float")
df.describe(percentiles = [0.1, 0.5, 0.9])
Filtering the data
Comparison Operators
< > <= >= == !=
We will use these operators to compare a specific value to values in the column.The result will be a series of booleans: True and Falses. True if the comparison is right, false if the comparison is not right.
Masking by closing price
When we pass a boolean series to a dataframe using loc[] operator, a new dataframe will be returned containing only the True values.
mask_closeprice = df.Close > 3000
high_price = df.loc[mask_closeprice]

high_price.head()
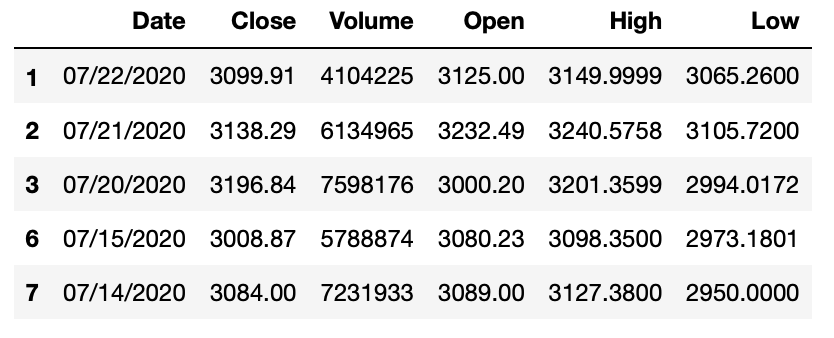
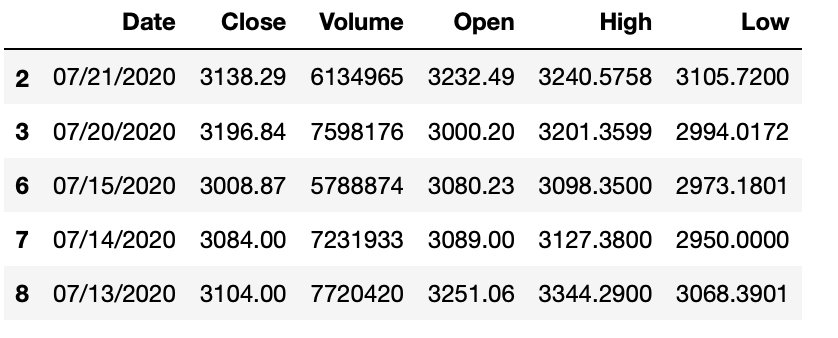
Pandas offers operators to combine different results of our boolean comparisons. These operators are: And, Or, Not. We can use these operators to create more complex conditions. For example, let’s say we want to see the AMZN stock data where the closing price is more than 3000 and the volume is more than 5 million. Here is how we do it:
mask_closeprice = df.Close > 3000
mask_volume = df.Volume > 5000000
high_price_volume = df.loc[mask_closeprice & mask_volume]

high_price_volume.head()
Visualizing the data
Visualizing the data is an important step in understanding the data. It helps us to see more than just rows of values, it gives us a better picture of the data. It is also helpful when we want to make comparisons between different data values.
Visualizing the data is also a great way to understand and see the relationships between different columns.
Matplotib
The most commonly used 2D plotting library is called Matplotlib. This library is very powerful, it has also a learning curve. With the help of this learning curve, other libraries have been built around this library.
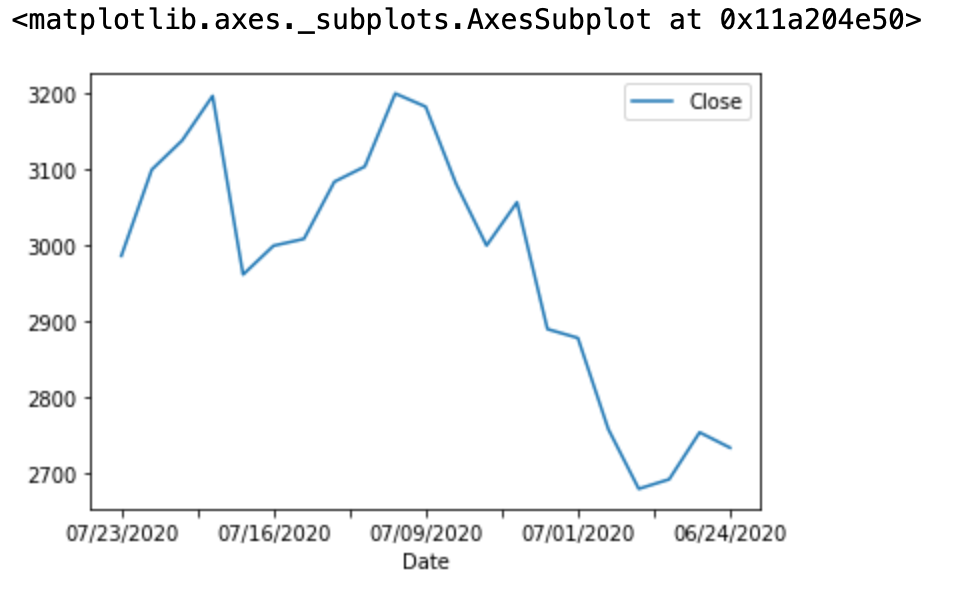
Let’s plot the stock prices of the last one month. Our x axis will be the date and Y axis will be the closing prices on each day. This will show us how the stock price changes during the one month period. Speaking from a business point, this line plot is called price fluctuation plot, which helps to detect seasonal patterns in the stock price.
df.plot(x='Date', y='Close')
Rotate
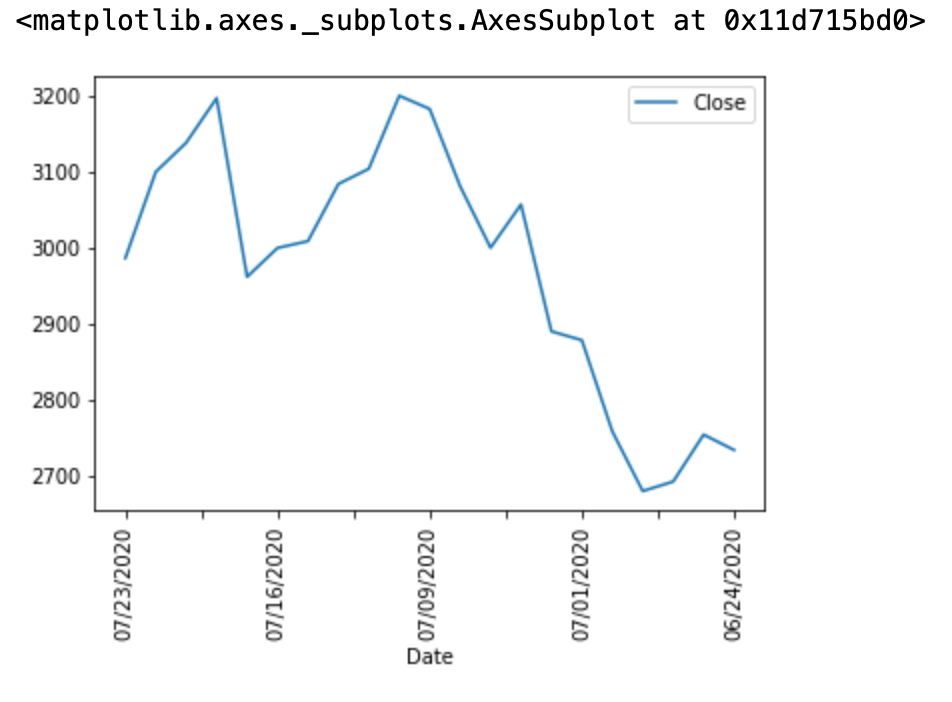
Plot method offers a lot of interesting parameters that you can try out. One of them is the rotation parameter, using this parameter we can rotate the labels of the plot. Here is an example of rotating the date label 90 degree so that it’s easier to read.
df.plot(x='Date', y='Close', rot=90)
Title
If you want to give your plot a title, this is the method to use. We will pass a string into our title parameter.
df.plot(x='Date', y='Close', rot=90, title="AMZN Stock Price")

Other Plot Types
The default type of plot method is line plot, but there are also many other plot types available to use depending on our use case. Such as:
- Line
- Bar
- Pie
- Scatter
- Histogram
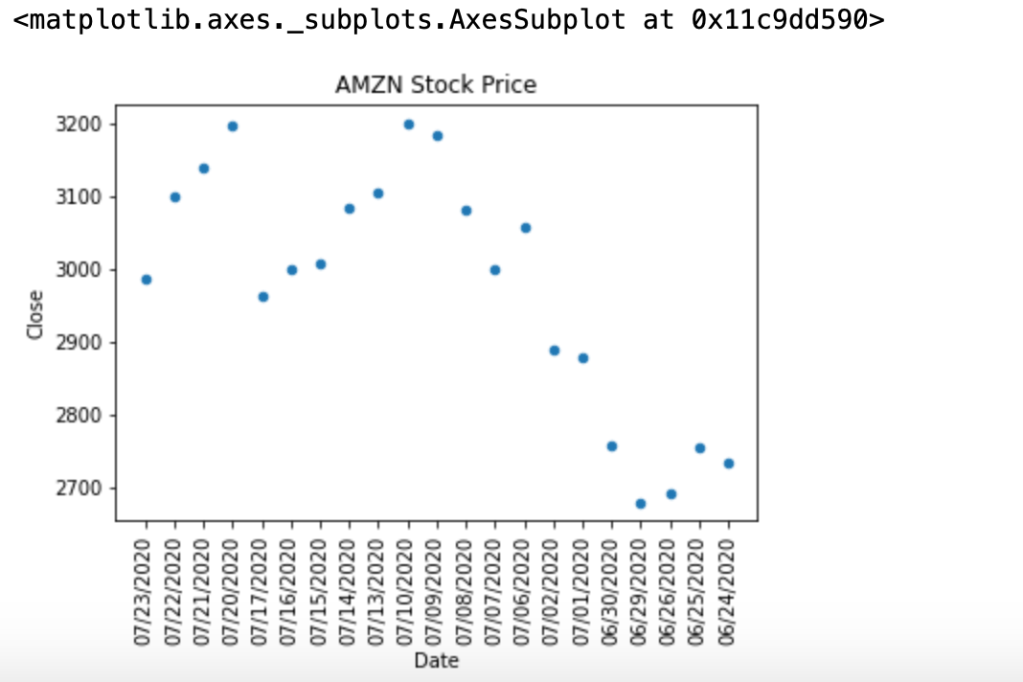
Let’s do an example of scatter plot. We will add a new parameter into our method called kind.
df.plot(x='Date', y='Close', kind='scatter', rot=90, title="AMZN Stock Price")
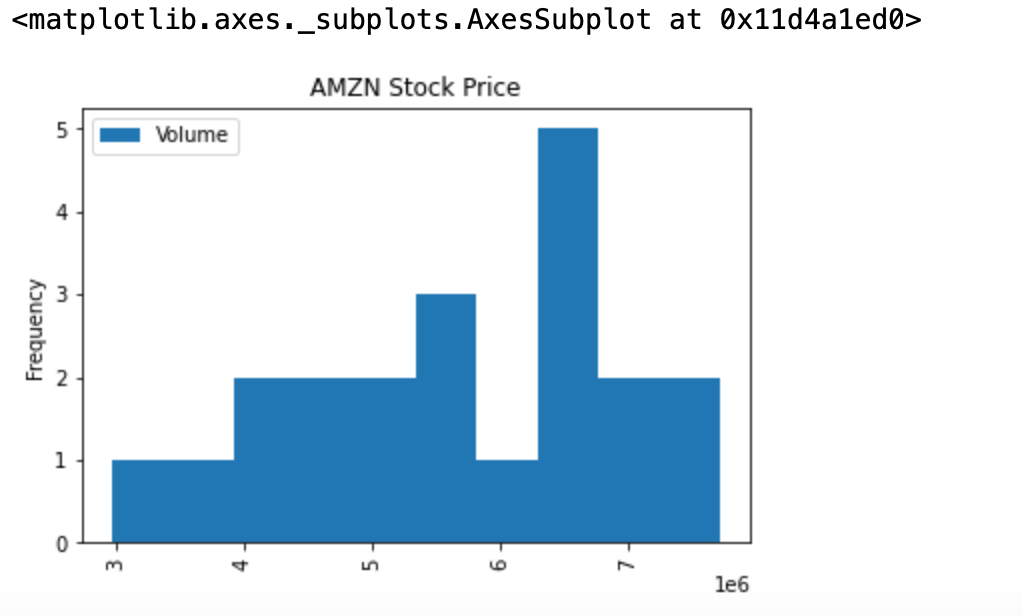
Now let’s do an example of histogram. Histogram plot is a great way to see the distribution of values.
df.plot(x='Date', y='Volume', kind='hist', rot=90, title="AMZN Stock Price")
Thank you for reading this post, I hope you enjoyed and learnt something new today. Feel free to respond if you have any questions while implementing the code. I will be more than happy to help. You can find other posts I’ve published related to Python and Machine Learning. Stay safe and happy coding! 🙂
I am Behic Guven, and I love sharing stories on creativity, programming, motivation, and life. Feel free to check my other stories on Medium.
