Tag: coronavirus
-
Global Spread of Coronavirus | Data Visualization
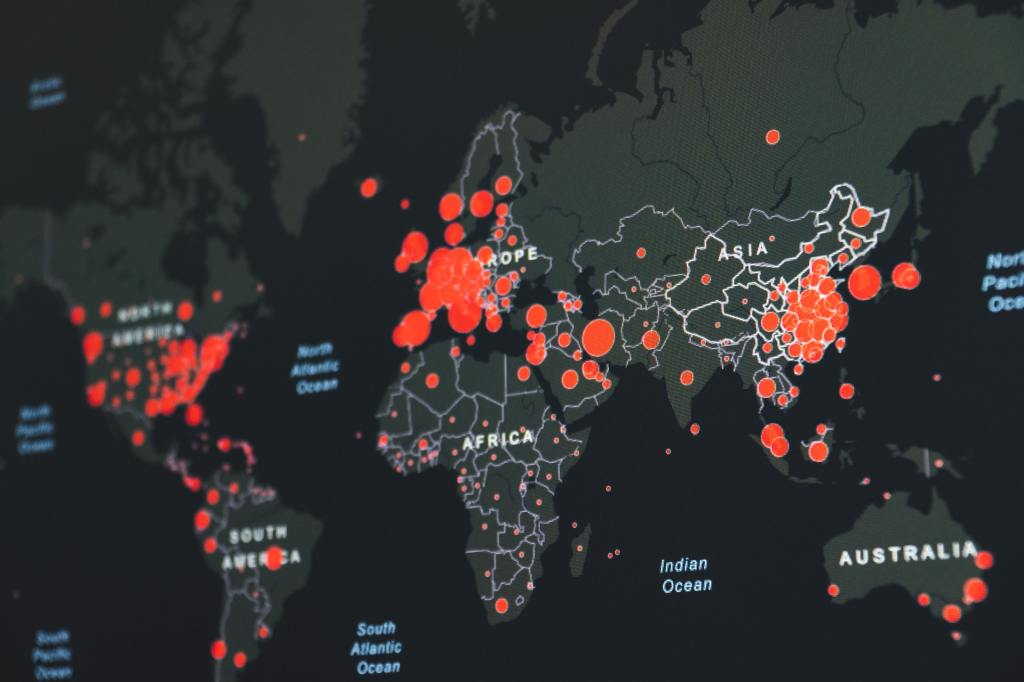
In this post, I would like to show you how to create an interactive map plot using the Coronavirus cases data. As the numbers started to rise again, I wanted to create a global world map to see how the spreading continues across the world. I found a great data on Kaggle with the global…
