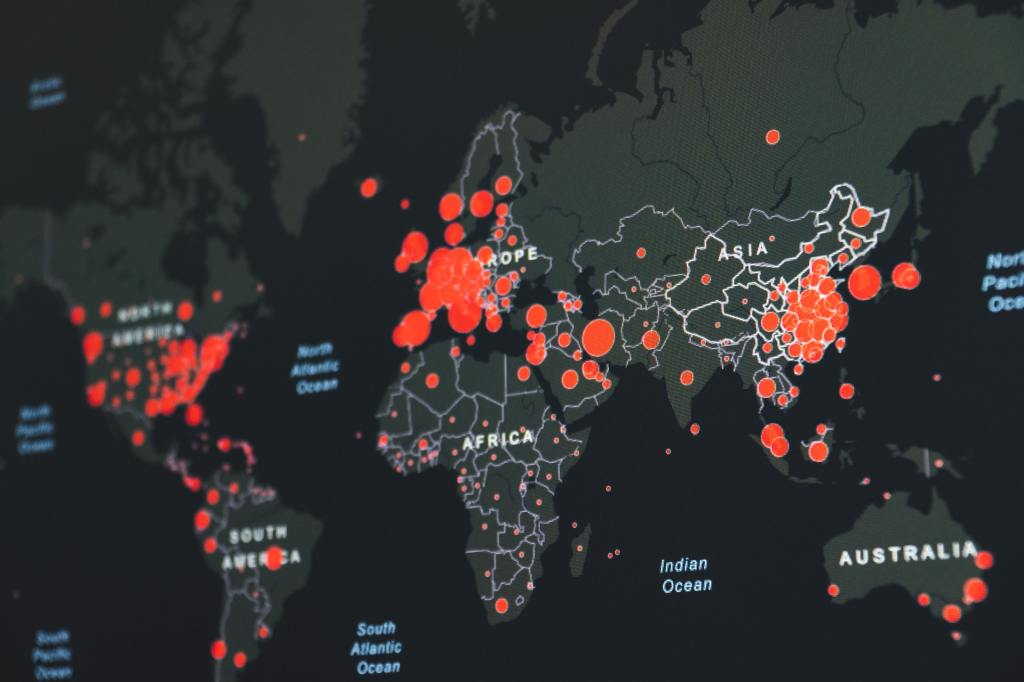
In this post, I would like to show you how to create an interactive map plot using the Coronavirus cases data. As the numbers started to rise again, I wanted to create a global world map to see how the spreading continues across the world. I found a great data on Kaggle with the global number of cases, I will add the data link below. If you haven’t heard about Kaggle, Kaggle is the world’s largest data science community with powerful tools and resources to help you achieve your data science goals.
Data visualization plays an important role in representing data. Creating visualizations helps to present your analysis in an easier form of understanding. Especially when working with large datasets it is very easy to get lost, that’s when we can see the power of data visualization. Let’s get started!
Table of Contents:
- Plotly
- Understanding the Data
- Data Preprocessing
- Data Visualization
Plotly
Plotly is Python graphing library that makes interactive, publication-quality graphs. Examples of how to make line plots, scatter plots, area charts, bar charts, error bars, box plots, histograms, heatmaps, subplots, multiple-axes, polar charts, and bubble charts. It is also an open-source library.
To learn more about Plotly: Plotly Graphing Library
Understanding the Data
This dataset has daily level information on the number of affected cases, deaths, and recovery from 2019 novel coronavirus. Please note that this is a time-series data and so the number of cases on any given day is the cumulative number.
Confirmed Cases Data can be downloaded from here: https://www.kaggle.com/sudalairajkumar/novel-corona-virus-2019-dataset/metadata
The data folder contains 8 dataset files, but the main one is called “covid_19_data.csv”, and the description of the dataset is as below:
- Sno — Serial number
- ObservationDate — Date of the observation in MM/DD/YYYY
- Province/State — Province or state of the observation (Could be empty when missing)
- Country/Region — Country of observation
- Last Update — Time in UTC at which the row is updated for the given province or country. (Not standardized and so please clean before using it)
- Confirmed — Cumulative number of confirmed cases till that date
- Deaths — Cumulative number of deaths till that date
- Recovered — Cumulative number of recovered cases till that date
For this project, which is building an interactive map, we will focus on Country and Confirmed columns. We will do this filtering under Data Preprocessing step. Let’s import the data and explore it.
Libraries
We will need three main libraries to get started. When we come to visualization I will ask you to import a couple more sub-libraries, which are also known as library components. For now, we are going to import the following libraries:
import numpy as np
import pandas as pd
import plotly as py
If you don’t have these libraries, don’t worry. It is very easy to install them, just write the following line in your terminal window:
pip install numpy pandas plotly
Read Data
df = pd.read_csv("data/corona/covid_19_data.csv")
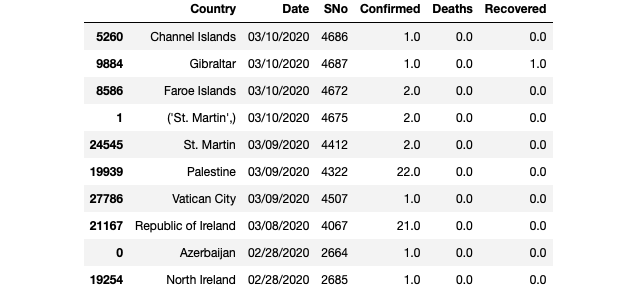
df.head()

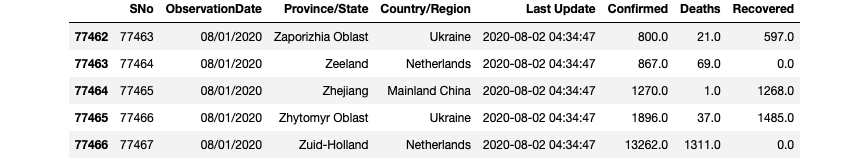
df.tail()
Data Preprocessing
Data Science is more about understanding the data, and data cleaning is a very important part of this process. What makes the data more valuable depends on how much we can get from it. Preparing the data well will make your data analysis results more accurate.
Let’s start by renaming the two columns: ObservationDate and Country/Region. We will use a Pandas method called “rename”.
# Rename columns
df = df.rename(columns={'Country/Region':'Country'})
df = df.rename(columns={'ObservationDate':'Date'})
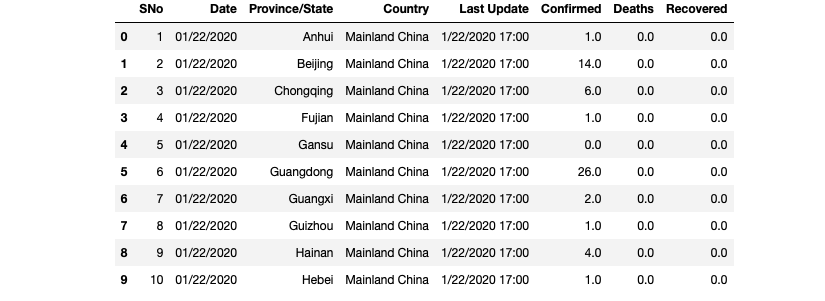
df.head(10)
Great! The column names are updated. We didn’t rename other columns because we will not use them in our visualization. Now, it’s time to do the data filtering. We will use a couple of methods for this step. Two of them are Pandas methods: groupby and drop_duplicates. And the third filtering is going to be using comparison operator.
# Manipulate Dataframe
df_countries = df.groupby(['Country', 'Date']).sum().reset_index().sort_values('Date', ascending=False)
df_countries = df_countries.drop_duplicates(subset = ['Country'])
df_countries = df_countries[df_countries['Confirmed']>0]
- In the first line, we are grouping by Country and Date columns. The sum function helps us to sum the confirmed cases. And then we are sorting them by date value.
- In the second line, we are dropping the duplicating Country values if there are any. Otherwise, it may cause issues when we are in the data visualization step.
- In the third line, we are filtering the confirmed cases. We are getting the rows with confirmed values that are more than zero.
Perfect! Now, let’s have a look at our dataframe. By the way, our new dataframe is called “df_countries”, we have defined it below. In the following steps, we will continue with the new dataframe.
df_countries.head(10)
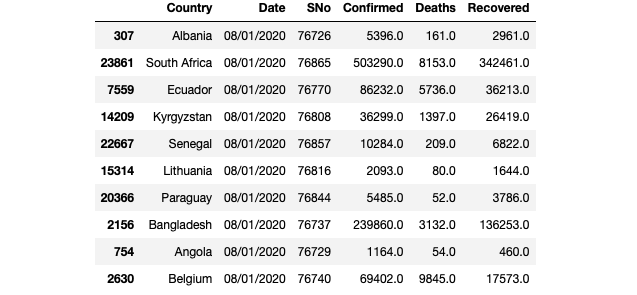
df_countries.tail(10)
Data Visualization
Well done! You have reached it until here to the final and fun part. We will add some components of Plotly to make those cool interactive map plots. Then we will create our interactive map plots.
import plotly.express as px
import plotly.graph_objs as go
from plotly.subplots import make_subplots
from plotly.offline import download_plotlyjs, init_notebook_mode, plot, iplot
Two Interactive Maps: The first one will be showing the confirmed cases as of August 1st. And the second map will be showing the increase of confirmed cases since January 22nd of this year.
Latest Numbers of Confirmed Cases
# Create the Choropleth
fig = go.Figure(data=go.Choropleth(
    locations = df_countries['Country'],
    locationmode = 'country names',
    z = df_countries['Confirmed'],
    colorscale = 'Reds',
    marker_line_color = 'black',
    marker_line_width = 0.5,
))
fig.update_layout(
    title_text = 'Confirmed Cases as of August 1, 2020',
    title_x = 0.5,
    geo=dict(
        showframe = False,
        showcoastlines = False,
        projection_type = 'equirectangular'
    )
)
fig.show()

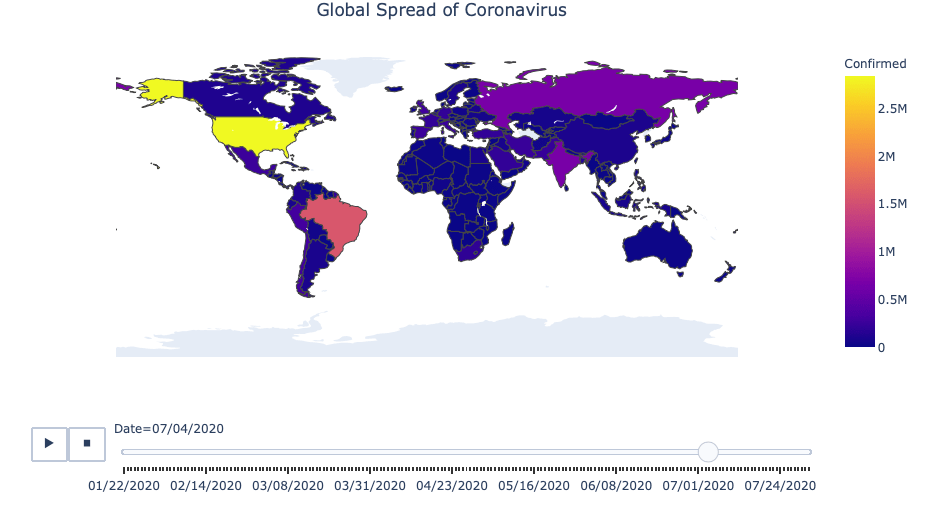
Global Spread of Coronavirus
# Manipulating the original dataframe
df_countrydate = df[df['Confirmed']>0]
df_countrydate = df_countrydate.groupby(['Date','Country']).sum().reset_index()
df_countrydate
# Creating the visualization
fig = px.choropleth(df_countrydate,
                    locations="Country",
                    locationmode = "country names",
                    color="Confirmed",
                    hover_name="Country",
                    animation_frame="Date"
                   )
fig.update_layout(
    title_text = 'Global Spread of Coronavirus',
    title_x = 0.5,
    geo=dict(
        showframe = False,
        showcoastlines = False,
    ))

fig.show()
Thank you for reading this post, I hope you enjoyed and learn something new today. Feel free to contact me through my blog if you have any questions while implementing the code. I will be more than happy to help. You can find more posts I’ve published related to Python and Machine Learning. Stay safe and happy coding!
I am Behic Guven, and I love sharing stories on creativity, programming, motivation, and life.
Follow my blog to stay inspired.
