Tag: data visualization
-
Global Spread of Coronavirus | Data Visualization
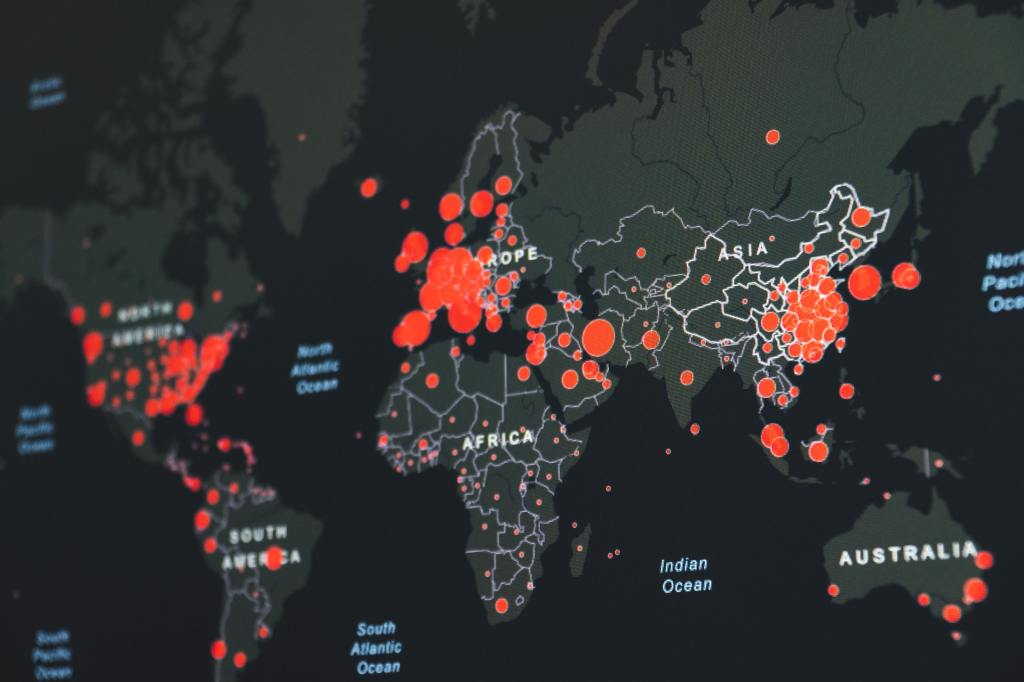
In this post, I would like to show you how to create an interactive map plot using the Coronavirus cases data. As the numbers started to rise again, I wanted to create a global world map to see how the spreading continues across the world. I found a great data on Kaggle with the global…
-
The Beginner’s Guide – Building Interactive Maps in Python

Simple and hands-on practice using Climate Data In this post, I would like to show you how to create interactive climate maps using the Historical Climate Data, where you can visualize, examine, and explore the data. Data visualization plays an important role in representing data. Creating visualizations helps to present your analysis in an easier form…
