
Hands-on Data Analysis using Pandas Library
In this post, we will learn some powerful data analysis techniques using Pandas library. Exploring the dataset is the first key step in data analysis. To have a better understanding of the data there are couple ways to do it. Today, we will cover the two simplest and most important ways to find interesting parts of the DataFrame. Sorting and Subsetting are the two that will be covered in this post. Enough with introduction, let me introduce you to our friend called Pandas.
Pandas is built on top of two essential python packages: NumPy and Matplotlib.
- NumPy provides multidimensional array objects for easy data manipulation that pandas uses to store data.
- Matplotlib has powerful data visualization capabilities that pandas takes advantage of.
There are several ways to store data for analysis, but rectangular data, also known as “Tabular data” is the most common used one.

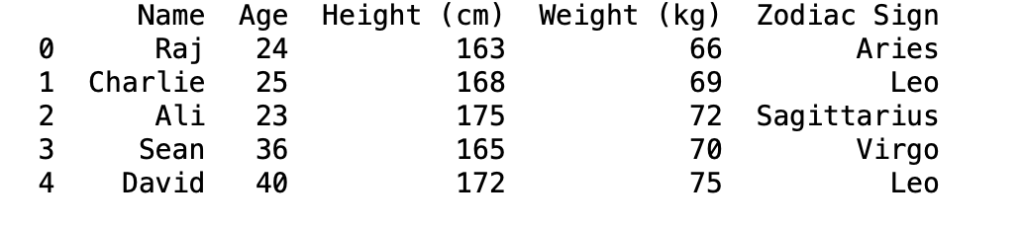
For example in the table below; each observation, or each person is a row. And each variable, or each person’s property is a column.
Pandas is designed to work with rectangular data like this one we have.
Pandas DataFrames
In pandas, rectangular data is represented as a DataFrame object. Every programming language used for data analysis has something similar to pandas. For example R also has data frames, and SQL has something called database tables.
Every value within a column has the same data type, either text or numeric, but different columns can contain different data types.
Import Data
First, we have to import pandas and then read the “data.csv” file using a special method called “read_csv”. You can create your own data document in excel or any spreadsheet program and then export it as a csv file.
import pandas as pd
df = pd.read_csv(“data.csv”)
print(df)
When you first receive a new dataset, first thing you want to do is to quickly explore and get a sense of the data. Pandas has some great methods to explore and even manipulate the data. Today, I will walk you through the following methods: sorting and subsetting the data. And I will show you the result of each of them to have a better understanding of how it works. Let’s start by sorting values.
Sort Values
First thing we will do is to change the order of the rows by sorting them. This way you will be able to see the end-yields of the data at the top of your DataFrame. You can sort rows using the sort_values method. You have to pass in the column name that you want to sort by your dataframe.
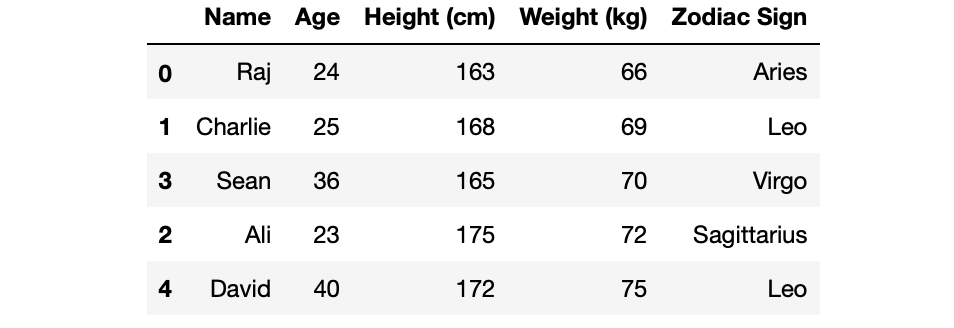
For example if we apply the sort_values method on the weight_kg column name, we will get them sorted by their weights. We will get the lightest person on top, heaviest at the bottom.
df.sort_values('Weight (kg)')
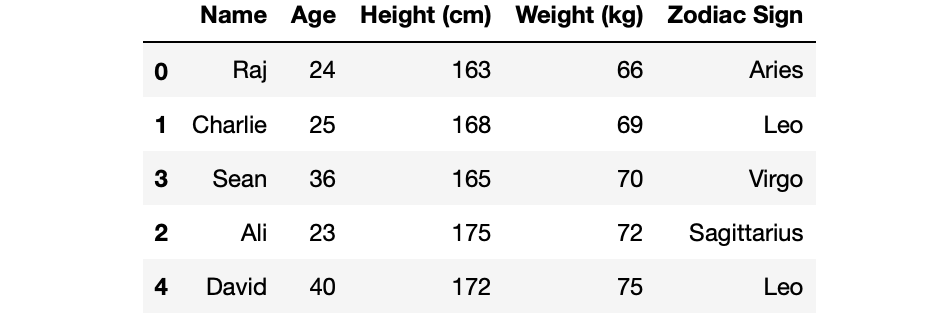
If you are wondering if it’s possible to sort the DataFrame according to multiple column names, yes it is possible. All we have to do is to pass the column names as a list inside sort_values method.
df.sort_values(['Weight (kg)','Height (cm)'])

To change the direction of the values are sorted, all we have to do is to add another attribute called ascending and then pass a list to that attribute. For our case, the people are now ordered from tallest to shortest.
df.sort_values(['Weight (kg)','Height (cm)'], ascending=[True, False])
Subsetting
Subsetting Columns
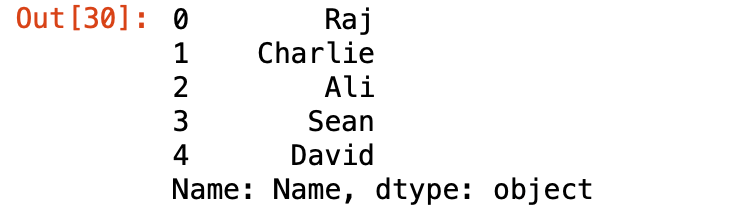
Subsetting is another way to explore the data and have a sense of it. Let’s say you want to see the values of just one column. We can do this using the name of the DataFrame followed by the column name inside the brackets.
df['Name']
It’s also very easy if you want to see multiple columns instead of just one. All you have to pass in the list of column names inside the brackets. I usually use this method to see if there are any close relationships between the columns.
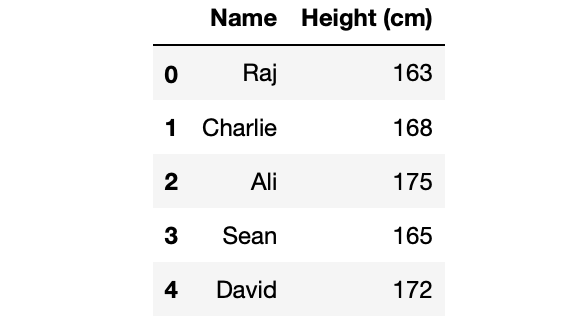
df[['Name', 'Height (cm)']]
Subsetting Rows
Subsetting the rows is another way of getting some understanding of the data. There are many ways of subsetting rows, but the one we will cover in this post is the most common way, which is to create a logical condition filtering method.
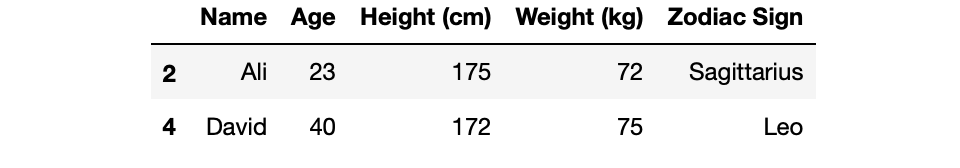
For example, let’s say we want to filter people who are taller than 170cm. We can do that with the following line:
df[df['Height (cm)'] > 170]
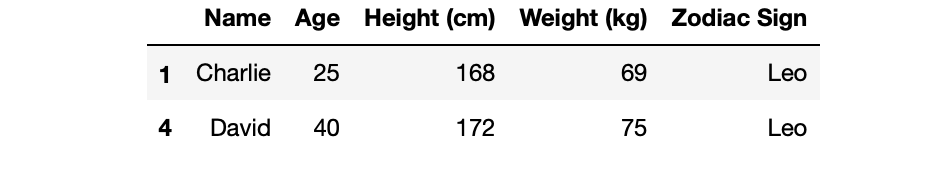
There might be string type columns, there is another way of filtering text data. The logical expression will be similar to that we did but this time we will use two equal signs to do the check.
df[df['Zodiac Sign'] == 'Leo']

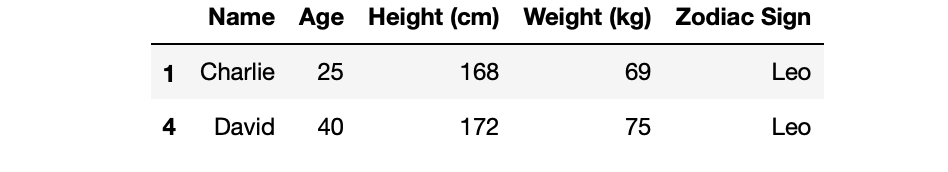
Lastly, if you want to subset rows depending on multiple conditions, all we have to do is to combine the conditions using logical operators such as “and” or “or”. Let’s do a quick example by filtering people who are taller than 160cm and their zodiac sign is leo. Great way to do it is to create two different conditions in different lines, and then combine them at the end using “and” operators.
tall_cond = df['Height (cm)'] > 160
sign_cond = df['Zodiac Sign'] == 'Leo'
df[tall_cond & sign_cond]
You can also do this subsetting in one line, and it will look as following:
df[(df['Height (cm)'] > 160) & (df['Zodiac Sign'] == 'Leo')]
Great Tip
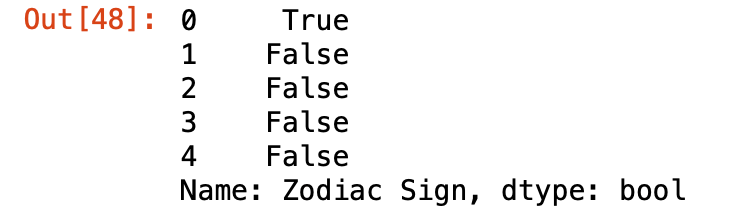
Lastly, this is one of the best practices of subsetting rows. There is a special method called “isin()” as you can understand its name, it filters the rows that have the specific values. This method is helpful when subsetting according to specific values, so no ranges. Here in the following example I will filter the rows where their zodiac sign matches with aries.
leo_zodiac = df['Zodiac Sign'].isin(['Aries'])
leo_zodiac
Follow my blog to stay inspired.
Thank you,
